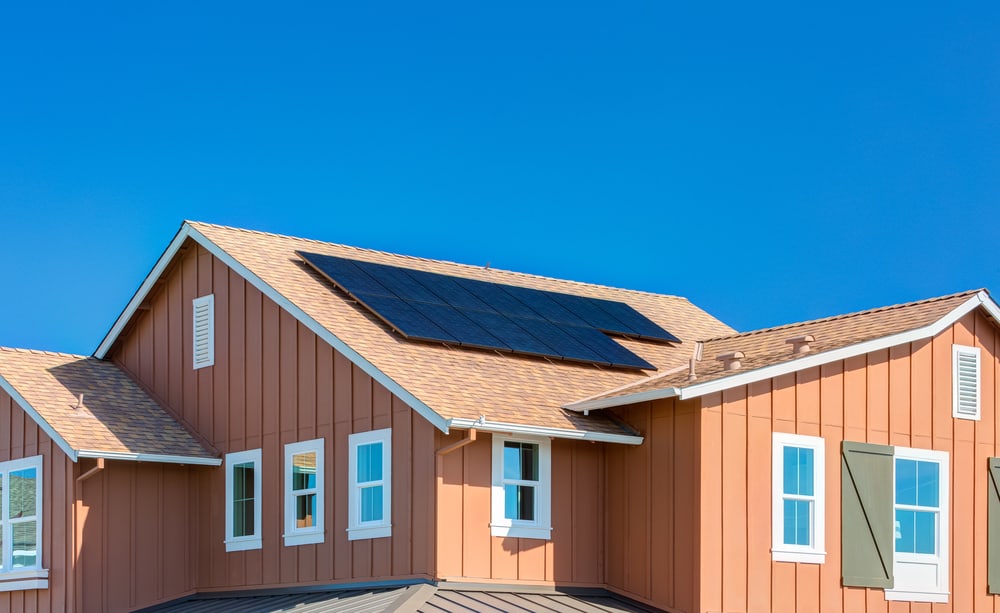
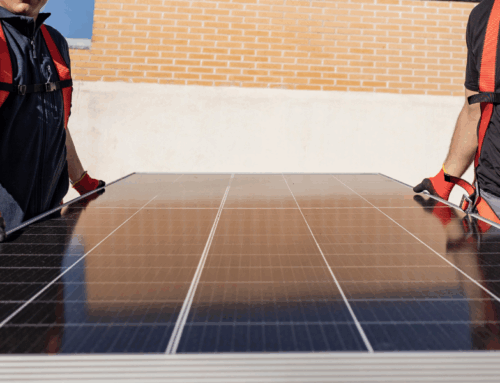
In the past, there was only one answer to the question, “What’s the best direction for solar panels to be pointed?” In the Northern Hemisphere, that direction was south. Because the sun shines directly over the equator most of the time, south-facing solar panels have an opportunity to collect more sunlight and generate more solar energy.
Every house has a different orientation to the sun, so every solar installation presents its own opportunities and challenges. The trick is to install the solar panels in a way that not only collects the most sunlight but also collects it in a way that strategically helps the homeowner save on their electricity bills.
South-facing solar panels have another advantage for homes that have access to net metering, which allows homeowners to get reimbursed for the power they send back to the electrical grid. South-facing solar panel orientation collects the most energy around mid-day when there’s lots of sun. But that’s also when the home’s consumption is typically lowest because everyone’s off to work, school, etc. That means there’s lots of solar-generated power left to go back to the utility.
But not all homes have a southern orientation, and, as all SunPower dealers know, even if they did, there are plenty of other variables that can affect which direction solar panels should face.
Your SunPower dealer will first survey your home for obstacles—like trees, chimneys, power lines, or taller buildings—that could block sunlight from reaching your SunPower® solar panels. A home facing a less-than-optimal direction or sun-blocking obstacles can still produce plenty of solar power, but it may take more solar panels than a roof with a great orientation and no obstacles at all.
SunPower dealers are also up-to-date on local rules and regulations that can have a big impact on the direction of solar panels. These regulations might affect a homeowner’s ability to take advantage of net metering, among other things. For instance, California added a wrinkle to its net metering plan in 2017 called “time of use” (TOU) rates, and that change directly affects solar panel placement.
Before TOU rates, homeowners got reimbursed the same rate for any power they sent back to the grid, whether it was generated at 10 a.m. or 4 p.m. But utilities face their biggest demand for power from customers from about 4 p.m. to 9 p.m. each evening, and they turned to TOU rates to help them cope with that.
TOU rates mean the 10 a.m. power sent back to the grid, which occurs at an off-peak time, is worth less to the homeowner than the peak-time 4 p.m. power. Since solar customers facing TOU rates make more money off evening power, their panels may need to be pointed west or southwest—not to the south—to catch more of the setting sunlight.
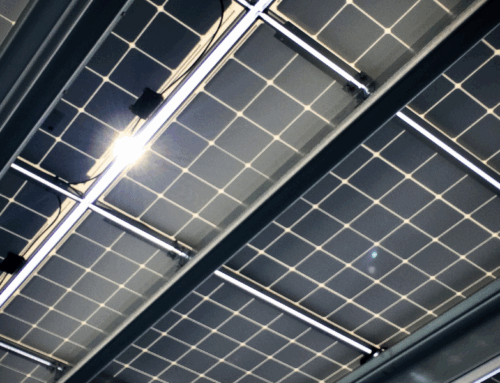
SunPower dealers also know that solar panel efficiency makes an enormous difference in planning an optimum solar installation. SunPower’s Maxeon® solar cell technology uses a one-of-a-kind design that captures a broad range of sunlight. Using more efficient panels means fewer panels are needed, and SunPower’s high-efficiency panels produce 55% more energy over 25 years than conventional panels within the same space.*
Placing solar panels around all the obstructions on a roof can be complex, but SunPower’s Design Studio makes it simple. Our software allows the homeowner to be involved in their own design, understanding how many panels will fit and the best places for them to go. That design can be enhanced by SunPower’s SunVault™ storage system, which allows homeowners to save excess power and prepare for emergencies.
Investing in solar power can help your pocketbook and the environment. Let an experienced SunPower dealer point your family in this exciting new direction.
© 2021 SunPower Corporation. This blog post was repurposed with the permission of SunPower. The original post can be found here: http://ow.ly/LAsY50H1mOP
* SunPower 400 W, 22.6% efficient, compared to a Conventional Panel on same-sized arrays (280 W multi, 17% efficient, approx. 1.64 m²), 8% more energy per watt (based on PVSim runs for average US climate), and 0.5%/year slower degradation rate (Jordan et. al., Robust PV Degradation Methodology and Application, PVSC 2018).


