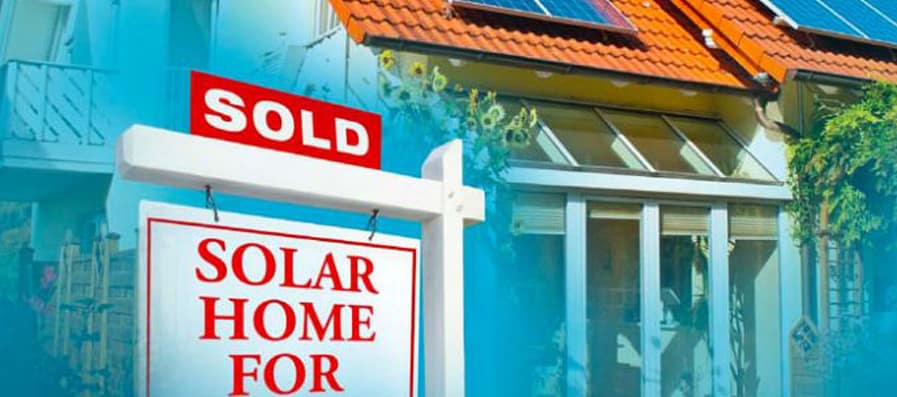
CNBC’s Power The Future released a new study, based on Zillow data, on how much solar adds to the resale value of a home. Whenever a study like this hits the press, it’s all the buzz in the solar industry.
Of all the financial benefits gained from going solar, how much a solar energy system adds to the resale value of a home has always been the most subjective, ambiguous, and oftentimes over-inflated or under-valued aspect of the financial analysis. When new studies come out, they are often used as blanket values by the solar industry. However, there are so many variables.
One of the flaws with past studies is they have been either based on California’s housing market or nationwide stats, which for the most part, don’t translate to the Puget Sound area. California has high electric rates, and many other States have significantly more sunny days than us. One study that came close but is outdated now was by the Appraisal Institute, which found that, for every $1 in annual electricity bill savings that solar panels provide, home resale values go up an average of $20.
A region’s electric rates are one of the main factors that dictate the financial benefits of having solar. Other items that need to be accounted for are:
- Regional demographics leaning pro-solar are not
- Regional household income
- Market penetration of solar
- How sunny or cloudy a region is
- Age of the system and
- System size
The Puget Sound area has the demographics, income, and progressive leanings; however, is this enough to overcome our lower number of sunny days and inexpensive electricity? My inclination has always been “maybe,” but not enough to assign a value to it when presenting the solar financials to prospective customers. When it’s brought up, I mention that it’s possible, but it is also dependent on who’s interested in their home at the time. If anything, it might generate more interest and make the difference if the selection is between a green home and a brown home, but will it consistently justify a higher sale value?
So, when I saw the heading of this report, “Solar power can boost your home’s value — especially in these 10 states,” I wondered if Washington would make the cut. To be honest, I wasn’t very hopeful, especially considering the cost of our housing market. Well to my surprise, it made the list at a very respectful fifth place with a 4.1% resale value increase! Being a Seattle resident with a median $713,100 home value, I had to temper my glee, realizing that our housing prices don’t represent the entire State. So are the ups and downs of the solar professional played out in mere minutes…not thinking we’d make the list, then realizing we did, but then cut it in half due to the State’s $390,000 median home value resulting in the 4.1% resale value increase calculating to $16,000. It’s very interesting to re-rank this list based on the dollar amount versus the percentage value. With this method, Washington ranks third on the list.
Unlike past studies, this one is regional, and we finally have numbers for Washington State and more so for the Puget Sound Region since this is where the bulk of the State’s solar homes are located.
Armed with these numbers, I quickly did the math. If we assume a typical size system of 6.5kW priced at $20,000, and the increased resale value (of a median-priced Washington home) is $16,000, this covers 80% of the initial investment! Now I’m doing cartwheels as this means a customer going solar can immediately justify the financials from the moment of purchase, since when combined with the 30% federal tax credit (reduced to 26% for 2020), it more than covers the system investment. This means relatively free energy from day one.
So how does the region with the least amount of sun, some of the nation’s lowest electric rates, and moderate incentives come in at 5th place? Our observations are that people going solar over the last year are driven or motivated by five items and that these items are what will motivate a potential home buyer to pay more for a solar home.
- Solar Market Acceptance – Washington State has lagged behind some of the larger solar states, such as California and Hawaii, with market acceptance. However, over the last year, we have seen a change in our customer engagement in that the conversation has transitioned from angst over a system’s payback and financials to what is the best system for their home. From 2005 through 2018, the State’s aggressive incentive programs drove the market. Now, when driving through most neighborhoods, rooftop solar can be seen on a frequent basis! Combined with many people knowing someone who has gone solar and it being so prominent in the news on a continual basis, the interest is becoming mainstream. There are five stages of customer adoption of new technology. The 1st are the Innovators, who are the first to “dip their toe in the water.” These were the few that went solar from the ’70s up to about 2008. The 2nd are the Early Adopters, who drove the market until recently. Now we are at the beginning of the 3rd stage, the Early Majority which is driven by affordable prices, technology awareness, and then everyone else is doing it mentality. The remaining stages are the Late Majority and Laggards. More information about these five stages can be found here.
- Puget Sound Region Economy – The greater Seattle area has one of the Nation’s highest household incomes, and with the prices of solar having fallen until recently, solar has become accessible to a larger population base.
- Climate Change Angst – Since the demographics of our region are environmentally conscious, most prospective solar customers are extremely concerned with the state of the nation and the health of the planet. With climate change having transitioned from “this-or-that will happen ten to twenty years from now” to “it is happening NOW!” combined with many recent anti-environmental policies, more and more people in good conscience can no longer continue contributing to the problem. Instead, they are empowering themselves by producing their own green energy.
- National Energy Policy – With the drastic change in the national energy policy focusing on antiquated and polluting fuel sources, such as easing pollution restrictions, opening up sensitive areas to oil exploration, subsidizing the coal industry, and foreign policies for secure and cheap oil (trillions of dollars annually), the majority of this region’s residents are angry and want change. Going solar empowers people to control where their tax dollars go by redirecting them away from harmful policies and towards a national renewable energy policy! For an average price system of $20,000, the 30% federal income tax credit results in $6,000 towards a renewable portfolio and $6,000 “less” for oil and coal subsidies.
- Weakening Economy – Those who fear a weakening economy and loss of trust in the stock market are diversifying their investments by re-investing in their home with a solar energy system. It’s a stable investment that has a known return based on offsetting the house’s electric usage and increasing the resale value of the home. Most homeowners are seeing a ten to fifteen-year payback, which doesn’t even include the additional home resale value.
This study does have some missing information that is necessary to translate this 4.1% into a solar system financial analysis. The most obvious is that a $20,000 6.5kW size system on a $2,000,000 home isn’t going to raise the resale price by $80,000 (4x the initial cost of the system). A small $8,000 system versus a very large $40,000 system is going to result in each system equally raising the resale value the same. The smaller system may raise it by 1.5% and the larger one by 8%. This is really an unknown since just the fact of solar being on the house, regardless of how effective it is, will make it more desirable, whereas a very large system might need to show financial savings to the buyer to justify a higher value.
Other unknowns are:
- Does the system have a Tesla Powerwall and/or high-quality solar panels such as SunPower?
- How does the age of the system factor in?
- What is the average size system for this data and the solar access of the system? (South versus East facing and no shading versus significant shading)
To keep it simple, we’ll go with the numbers at hand. If a 6.5kW system increases the resale value by $16,000, then to take the size of the system into account, this is approximately a $2,500 increase for every 1.0kW of solar. A 2.0kW system is an increase of $5,000, and a 10.0kW system is $25,000. To shoot for better accuracy, penalize for:
- Every 1.0kW above the average system (in our case, it’s 6.5kW)
- Older systems (less for systems with higher quality modules such as SunPower)
- Systems with below-average solar access.
For those of you that have solar on your home, have fun with the math. Perspective, solar home buyers, trying to make sense of all of this, and those of you thinking of going solar… well, just give us a call so we can walk you through the numbers!
This post originally appeared on the SunPower Resource Blog.


